Jockey and Trainer Statistics in UK Horse Racing
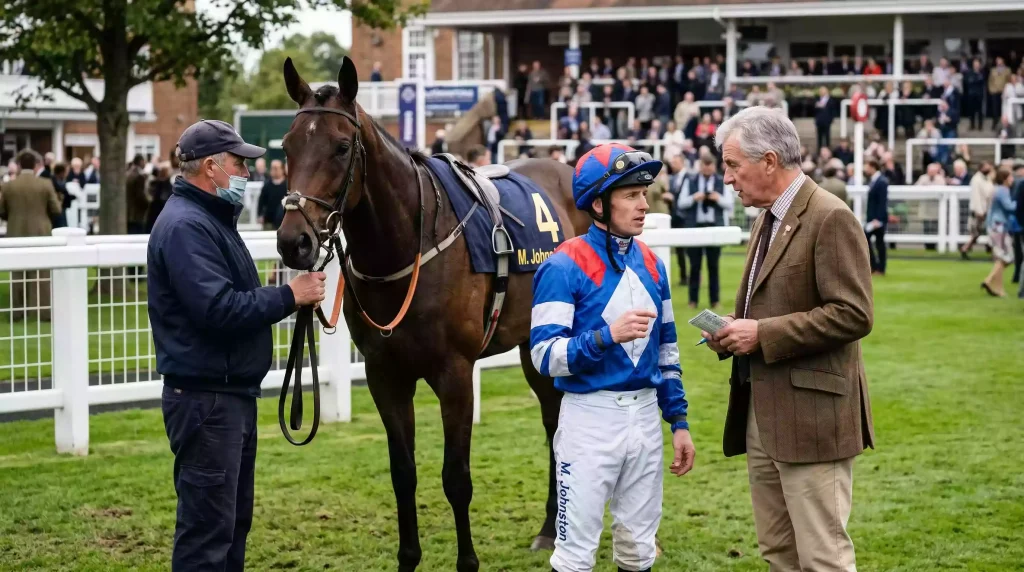
A horse does not arrive at the racecourse by accident. It was selected for this race by a trainer who assessed its fitness, its form and its chance. It will be ridden by a jockey chosen for this specific task. The human decisions behind every runner are as much a part of the result as the horse’s ability, and the statistics that track those decisions — jockey win rates, trainer strike rates, course records, seasonal patterns — are among the most practical tools available for reading results and anticipating future ones.
Jockey and trainer statistics in horse racing are not hidden data. They are published daily on major platforms. What matters is knowing which statistics are genuinely predictive and which are noise. A trainer with a 15% strike rate sounds competent — but if that figure drops to 3% at a specific course or in a specific class of race, the headline number is misleading. The detail is where the edge lives.
Key Stats to Track for Jockeys
The most useful jockey statistic is the strike rate — the percentage of rides that result in a win. A jockey with a 20% strike rate wins one in every five rides, which in a sport where the average race has roughly nine runners is a significant overperformance against random chance. But the headline strike rate needs breaking down.
Course-specific records matter because different tracks suit different riding styles. A jockey who excels at Chester — a tight, left-handed track where positioning is everything — may have a lower strike rate at wide-open galloping tracks like Newbury, where the race is more about the horse’s raw ability than the rider’s tactical nous. Going preferences also filter the picture: some jockeys ride heavier ground more effectively than others, and their strike rate on soft or heavy going may diverge sharply from their rate on firmer surfaces.
Jockey-trainer combinations are a separate and powerful data set. Certain trainers consistently book the same jockey for their best-fancied horses, and the results of that specific partnership often outperform both the jockey’s overall rate and the trainer’s. Identifying these partnerships — through the combination filter on Racing Post or Timeform — and tracking their results is one of the more straightforward statistical exercises available to the form student.
With over five million people attending British racecourses in 2026, the sport’s most recognisable jockeys carry public profile as well as statistical records. But popularity is not the same as profitability. A glamorous name on the racecard attracts money and shortens the SP, which can reduce the value even when the jockey wins. The statistical approach cuts through the noise: track the strike rate, the course record, and the trainer link, not the name recognition.
Key Stats to Track for Trainers
Trainer statistics operate on a different timescale to jockey stats. A jockey’s form can shift within days — a confident jockey riding winners breeds more winners. A trainer’s form moves in broader waves, shaped by the fitness of the string, the quality of the horses in the yard, and the seasonal cycle. Jump trainers peak during the winter months; Flat trainers peak in summer. A jump trainer showing a 25% strike rate in March is on fire. The same rate in August, when only a handful of their horses are running, may be meaningless.
Course records for trainers are even more revealing than for jockeys. Some trainers target specific courses with specific types of horses — sending their fast ground specialists to Ascot, their stayers to York, their all-weather horses to Wolverhampton. The results archive, filtered by trainer and course, exposes these patterns. A trainer who has sent 30 runners to Chelmsford and won with eight of them has a 27% course strike rate — far above the norm — and that is actionable information.
The 14-day, 28-day and 56-day form windows are standard metrics. A trainer in good recent form (high strike rate over the last 14 days) is likely to continue performing above average in the short term. Conversely, a yard in a cold spell — no winners in three weeks — may be dealing with a virus, a change in feed, or simply a run of bad luck. The results tell you the what; the timescale tells you the when.
Average field sizes — 8.90 on the Flat and 7.84 over jumps in 2026 — provide the denominator against which trainer strike rates should be measured. A trainer winning 15% of races against average fields of nine is outperforming the base rate of approximately 11%. That margin, compounded over hundreds of runners, represents genuine skill in race selection and horse preparation.
Where to Find These Statistics
Racing Post publishes trainer and jockey statistics on every racecard and result page. The data includes overall season figures, course-specific records, and recent form over 14 and 28 days. The platform also allows combination searches — jockey A with trainer B at course C — which is where the most specific and useful data lives.
Timeform offers similar statistics, layered with its own analytical commentary. The BHA’s annual Racing Report provides macro-level data on trainer and jockey populations, licence numbers and competitive metrics, though not individual statistics. Proform Racing takes a more quantitative approach, offering statistical tools — actual versus expected performance indices, chi-squared analysis of form patterns — that appeal to the data-driven bettor.
For those who prefer raw data, the RacingFormBook CSV files include trainer and jockey identifiers that allow you to build your own statistical models. Filtering a decade of results by trainer, course, going and race class is straightforward in a spreadsheet and produces insights that no pre-built platform can replicate, because you control the parameters.
Combining Human Stats with Results
The most effective form study workflow integrates jockey and trainer statistics with the race result itself. Start with the result: which horses finished where, at what SP, on what going? Then overlay the human data: was the winning jockey on a hot streak? Does the winning trainer have a strong record at this course? Was the losing favourite ridden by a jockey with a low strike rate at this track?
The BHA’s 2026 Racing Report observed that betting customers are increasingly focusing their activity on the bigger racedays — Premier fixtures where prize money is highest and the best jockeys and trainers are in action. At Premier fixtures, the average turnover per race was 1.1% higher than the year before, while at Core fixtures it declined by 8.1%. This concentration of attention means that jockey and trainer statistics at the top level are more heavily scrutinised — and more efficiently priced — than at the lower tiers. The statistical edge is often greater at a Monday afternoon meeting than at a Saturday Premier fixture, precisely because fewer people are looking at the numbers.